
Rydberg atoms distinguish phone signals in a new laboratory test
A laboratory study connects an atomic response with a wireless-signal classifier.
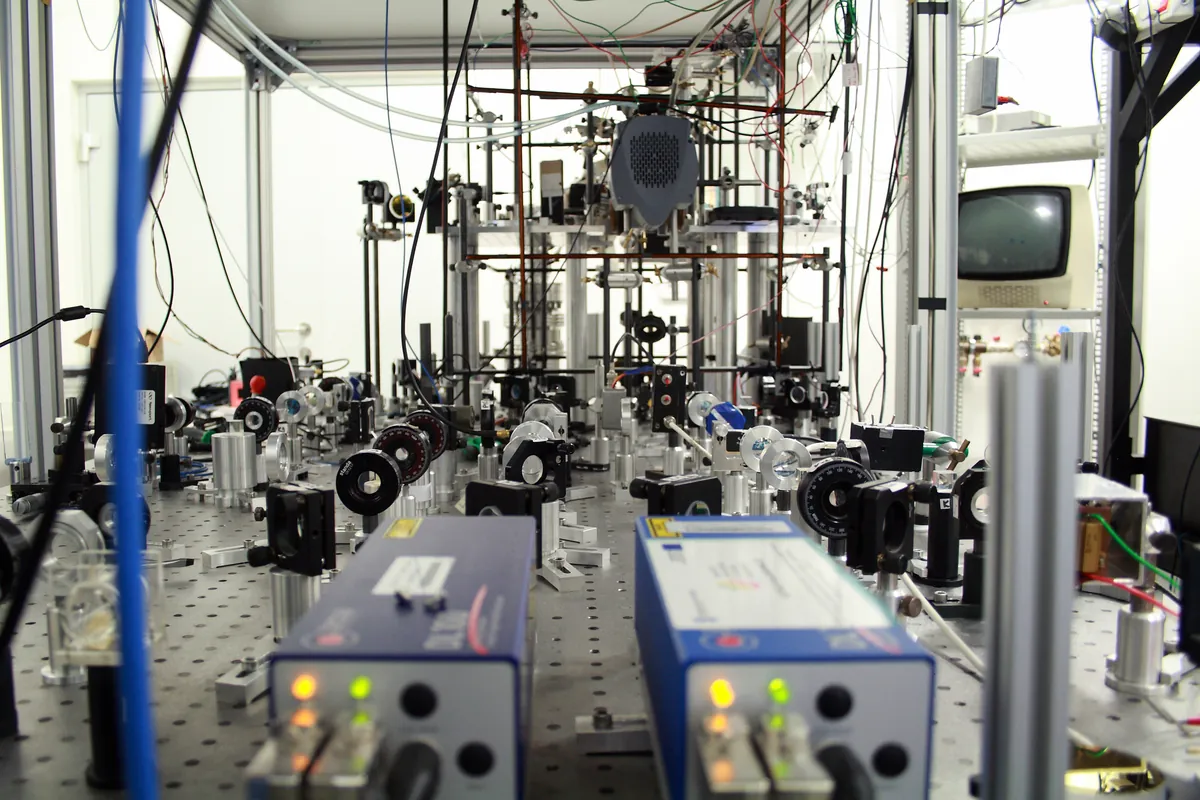

A quantum sensor experiment has moved beyond detecting a radio signal to classifying the kind of wireless activity that produced it. A preprint by Yi-Ming Yin and colleagues combines Rydberg-atom spectroscopy with a convolutional neural network to identify emissions from cellular voice calls, Wi-Fi and 5G.[1]
The researchers assembled spectral fingerprints using three commercial smartphone brands. They report 93.44 percent baseline classification accuracy, then use progressive fine-tuning to compensate for changes in the measured spectra over time and under different environmental conditions.[1]
A separate real-time test covered 60 seconds of changing wireless activity, including voice calls, Wi-Fi and simultaneous signals. Its overall frame-level recognition accuracy was 87.67 percent. Those results should remain separate: the higher number describes the baseline classification result, not every live monitoring condition.[1]
The October 26 preprint presents a laboratory route to radio-frequency signal awareness. It does not demonstrate decoding private messages or establish performance across arbitrary phones, locations or interference conditions.[1]
Learn: Give a live signal classifier its own benchmark
A classifier tested on stored data and a classifier operating on a live stream face different evaluation conditions. Both measurements can be useful. Their meaning depends on how the data were collected, how the model was trained and what counts as a correct decision.
The linked Rydberg-sensor study reports separate baseline and live frame-level results. Keeping those metrics separate lets readers see what was tested instead of treating one accuracy figure as a universal property of the device.[1]
Worked example
Hypothetical example: a system labels 900 of 1,000 held-out recordings correctly, then labels 800 of 1,000 live frames correctly in a changing environment. The two scores describe two tests. The difference alone does not establish whether the cause is environmental drift, a changed mix of signals, timing constraints or some other factor. Investigating that difference is part of evaluating the complete sensing system.
Accuracy also depends on what appears in the test. If 95 percent of an imagined stream contains one class, a classifier that always chooses that class obtains 95 percent accuracy while missing every occurrence of the other class. A useful report therefore shows performance for each relevant signal type and identifies false alarms and missed detections.
Data separation deserves attention. Nearby frames can be closely related. A convincing evaluation should explain how it prevents nearly identical examples from making the training and test sets artificially easy to match. It should also state whether adaptation uses information that would genuinely be available during deployment.
For live operation, readers need a duration, response time, signal conditions and a definition of the decision unit. A frame-level score is different from correctly identifying an entire event. Testing across longer periods and unfamiliar environments can then reveal how well the method generalizes. These details turn an encouraging demonstration into a result that others can reproduce and compare fairly.