
Quantum in pictures
The experiment behind a crystal of bright dots
A NIST photograph from 2012 turns an engineered quantum simulator into a visible pattern—and opens a useful question about how such experiments are checked.
Research context: October 19, 2026 · Source review: October 20, 2026
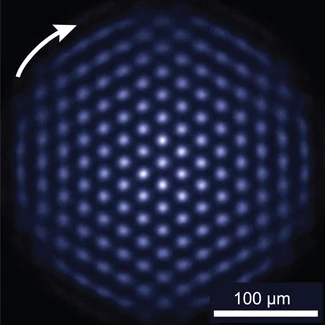
Here the pattern of bright spots is experimental imagery rather than an artist’s array of decorative spheres. NIST identifies it as fluorescence from an ion crystal whose arrangement forms a triangular lattice. The existing scale bar and arrow are part of the published image and should remain visible. Use the file to teach readers to look for a measurement method, scale and preparation conditions before interpreting a striking scientific picture. Do not infer that every bright point is executing a useful logical operation. The image documents a prepared physical arrangement; computational capability requires evidence about the operations and measurements performed on it.
Joe Britton / NIST — Quantum Simulator Crystal.jpg — Public domain — https://commons.wikimedia.org/wiki/File:Quantum_Simulator_Crystal.jpg — https://commons.wikimedia.org/wiki/File:Quantum_Simulator_Crystal.jpg#Licensing.Full original frame retained; EXIF orientation normalized where present, resized without enlargement and converted to WebP. No crop or content alteration.
The pattern is almost immediately legible: bright points form a compact triangular arrangement against a dark background. NIST identifies the photograph as a crystal of fluorescing ions in a quantum simulator, and its original image record dates it to April 25, 2012. The small arrow and scale bar are already part of the source image. They belong to its scientific presentation and should remain visible when it is reproduced.[1]
The photograph is striking because the many-particle system has a shape. The ions organize into a nearly regular plane, giving readers a way to locate individual sites and neighboring relationships. Brightness makes the structure visible; it does not provide a complete picture of the quantum state. An image of positions and fluorescence is one observation within a larger experimental procedure.
NIST’s contemporary report describes beryllium ions held in a Penning trap, with electronic states used as effective quantum spins. Carefully controlled microwave and laser operations produced interactions intended to model aspects of another quantum system. The associated Nature paper described engineered Ising interactions in a two-dimensional trapped-ion system. The point of the apparatus was to study a selected mathematical model through controllable physical behavior.[2][3]
That correspondence is the central idea of a quantum simulator. The experimental object does not have to resemble the material it helps investigate. What matters is whether the degrees of freedom, interactions and measurements represent the intended model closely enough for the scientific question. A lattice of ions can therefore be useful for studying collective magnetic behavior without being a miniature sample of the material in question.
There is an especially instructive detail in the 2012 account: the benchmarking experiments used weak interactions so that their results could be compared with classical calculations. That choice illustrates a general strategy for learning to trust a complex instrument. Begin in a regime where another method can check the answer. Change a controlled setting. Look for agreement where agreement is expected, and investigate discrepancies before making stronger claims about a harder regime.[2]
The distinction between a site and an interaction is especially useful. A site identifies a degree of freedom in the model. An interaction describes how the behavior of one site depends on another.
A measured correlation then asks how outcomes relate across sites. Looking at those three ideas separately helps explain why a beautifully ordered pattern is a starting point for the experiment, rather than the entire scientific result.
The date also matters to the reading experience. This is an archival picture of a particular research program, not an image of a new 2026 device or a current qubit-count record. Its continuing value is conceptual. Readers can see an ordered physical system, then ask how researchers turn that order into a controlled experiment and how they establish that the experiment is doing what they intend. The bright dots attract attention; the method of checking them gives the image a lasting story.[1][2][3]
How a simulator earns a comparison
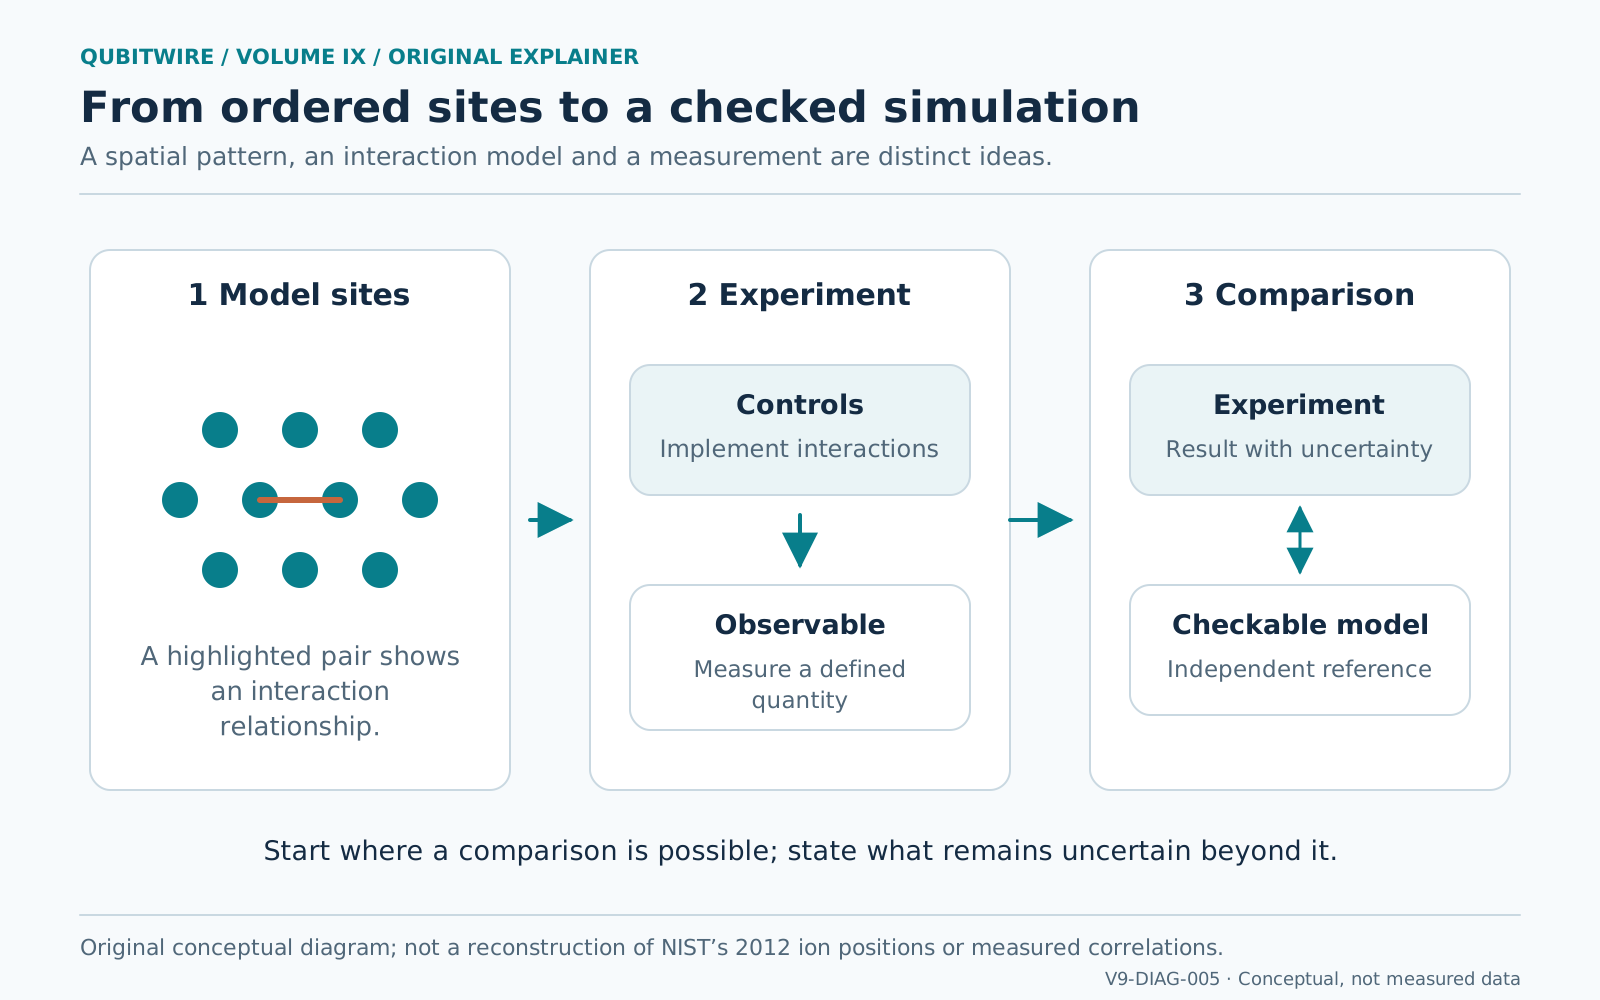
Three panels separate a conceptual triangular arrangement of sites, controls that implement interactions and a measured observable, and a comparison between experiment and a checkable model. No displayed point or line represents measured data; the original ion-crystal photograph is a separate fluorescence image.
Conceptual explanation; not an apparatus construction drawing or a measured result. Original QubitWire explanatory diagram.
Sources and further reading
- Quantum simulator crystal photograph ↗NIST / Joe Britton
Original photograph record, creation April 25, 2012 and photographer credit.
- NIST Physicists Benchmark Quantum Simulator with Hundreds of Qubits ↗NIST
Beryllium-ion Penning-trap system, fluorescence and weak-interaction benchmarking. Historical claims are bounded to 2012.
- Engineered Two-Dimensional Ising Interactions in a Trapped-Ion Quantum Simulator with Hundreds of Spins ↗NIST / Nature authors
Primary research identity and engineered Ising-model context.