
Quantum in pictures
A grid of sensors is only the beginning of a measurement
The actual array behind a nuclear-monitoring study helps explain why better measurements require more than counting sensors.
Research context: October 19, 2026 · Source review: October 20, 2026
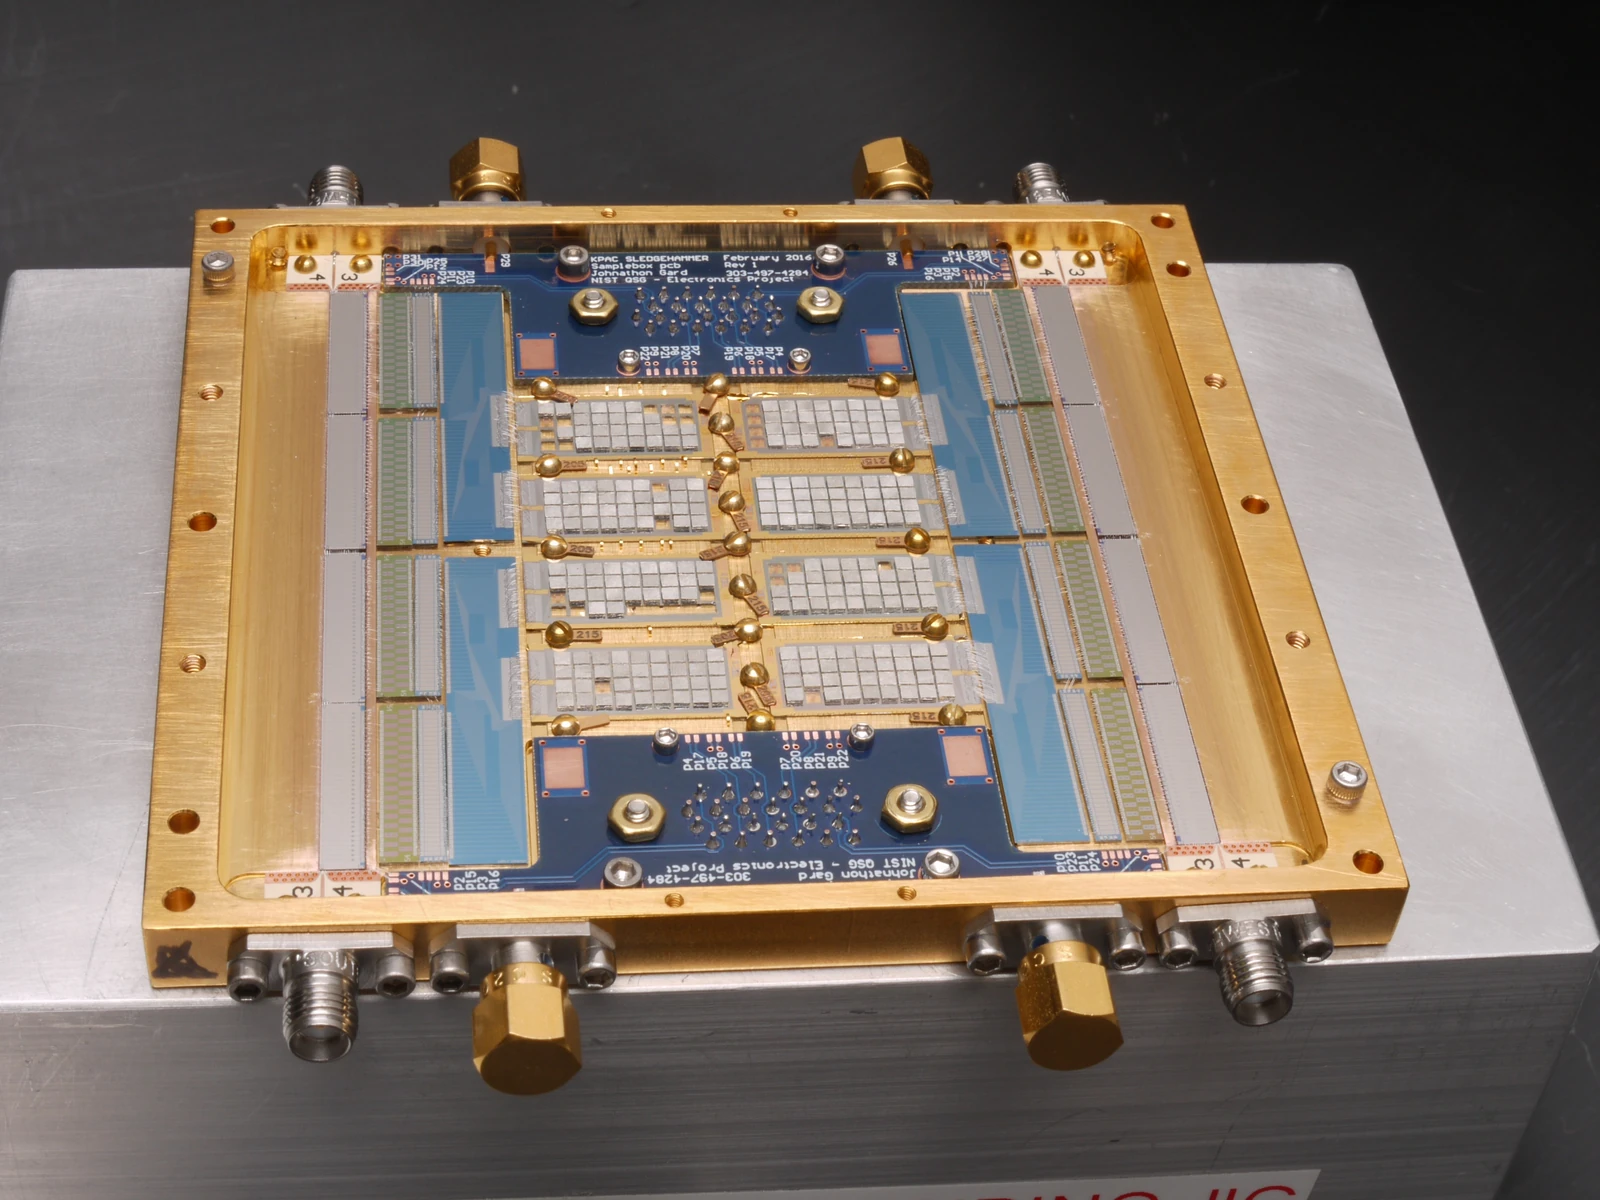
A sensor array makes a measurement system visible without making its performance visible. The repeated light rectangles sit inside a larger assembly of connectors, a circuit board and a mechanical frame. Those surrounding parts matter because the sensing elements must be addressed and their signals carried away. NIST associates this photograph with its nuclear-monitoring work. The picture can introduce the apparatus, but accuracy still requires calibration data, uncertainty estimates and a description of the material being measured. Notice the older date printed on the board: a photograph accompanying a new result does not imply that every component was newly manufactured.
NIST — Transition-edge sensor array used in nuclear-monitoring research — Public domain in the United States; NIST worldwide reuse terms — https://www.nist.gov/image/transition-edge-sensors — https://www.nist.gov/open/copyright-fair-use-and-licensing-statements-srd-data-software-and-technical-series-publications.Full original frame retained; EXIF orientation normalized where present, resized without enlargement and converted to WebP. No crop or content alteration.
The gold frame attracts attention first. Inside it, pale rectangular sections repeat across a blue circuit board. Connectors and a larger gray mounting plate surround the central array. This is the apparatus photograph NIST associates with its September 2026 nuclear-monitoring study. The source describes about 250 transition-edge sensors; it is a sensor array, not a processor with 250 computing qubits.[1][2]
The measurement problem concerns overlapping radiation signals. NIST reports using the sensors to improve measurements of X-ray emissions that complicate the interpretation of gamma-ray spectra. A transition-edge sensor operates near a superconducting transition, where a small deposited energy produces a measurable electrical response. The study concerns the quality of that measurement, not simply the existence or number of patterned elements.[2]
The photograph is a good way to make that distinction concrete. Countable features tempt us to use a count as a performance score. A larger count might provide useful opportunities, but it cannot tell a reader how the elements were calibrated, which channels were accepted or how their responses were combined. The real scientific object is the measurement process that turns an incoming event into an interpretable result.
Consider an invented classroom exercise with two sensors measuring the same reference signal. Their raw outputs differ. That difference does not immediately mean one is broken; each may have a different response that must be calibrated. Now imagine repeating the exercise across an array, checking whether the calibration remains stable and asking what to do when a channel behaves differently. No numerical performance claim is needed to see why the surrounding electronics and the measurement protocol matter.
Next, distinguish separation from certainty. Two features in a spectrum may become easier to tell apart while an uncertainty remains in their location, width or interpretation. A graph with visibly sharper peaks can be persuasive, but an editor should still ask what was fitted, which reference information was used and which uncertainty belongs to the reported quantity. A useful visual story can introduce these questions without drawing a fabricated spectrum or inventing a before-and-after comparison.
The most helpful companion graphic would be conceptual: an incoming event, a sensor response, a calibration step and a reported estimate with uncertainty. It should carry a prominent “conceptual sequence” label and no numerical axes. The actual data belong in the source paper, reproduced only when the figure’s permissions and context have been checked. Readers then get both kinds of help: a clear explanation of the workflow and a route to the evidence.
There is also a small dating lesson on the board. The photograph visibly includes a February 2016 marking, while the official image page supplies a July 2026 creation date. Those observations are compatible. A newly reported measurement can use an older board or another retained component. The date attached to a scientific result should not silently become a fabrication date for everything in its lead photograph.[1]
Use the full array as the lead for the associated monitoring story. If the image later accompanies a broader sensor explainer, identify it as that specific NIST array and preserve its original context. The hardware earns attention because it helps readers ask better measurement questions. Its value lies in connecting a visible instrument with the calibration, analysis and uncertainty that make the result useful.
Sources and further reading
- Transition-edge sensors ↗NIST
Exact array identity, institutional credit and July 15, 2026 image creation date.
- NIST-Developed Quantum Sensors Improve Nuclear Monitoring ↗NIST
September 10 study context, approximately 250 sensors, overlapping emissions and basic sensing principle.