
Can a changing workload mix reverse a performance comparison?
An overall score weights each workload by its frequency. Comparing providers on a common reference mix can reverse the ranking from their original aggregate scores.
Source research checked . Teaching calculations are ideal models.
A benchmark suite is a distribution of questions. If a provider runs mostly easy instances while another tackles mostly hard ones, their overall completion percentages answer different questions. Neither percentage is wrong as a description of its own workload. The mistake occurs when the two denominators are treated as interchangeable evidence about the methods.
The constructed example contains only two strata, easy and hard. Method B improves the stipulated success probability in both. It is nevertheless possible to make B look worse overall by allocating more hard work to B. The reversal comes entirely from the weights. There is no hidden quantum effect and no arithmetic paradox once those weights become visible.
Standardization chooses one reference workload and evaluates both methods against it. That requires a defensible reference: the published challenge set, a fixed deployment distribution or a clearly labeled teaching mixture. A fair comparison keeps both the observed mix and the standardized comparison. Discarding the operational mix can erase useful information about what a service actually handled; discarding standardization can reward an easier test.
Start with the assumptions
- Within-stratum rates are known synthetic probabilities.
- Easy and hard are fixed categories with comparable meanings.
- No uncertainty intervals are attached to stipulated rates.
Mixed success = easy_fraction × p_easy + (1-easy_fraction) × p_hard
Standardized success uses the same easy_fraction for both methods
Percentage-point difference = 100 × (p_B - p_A)
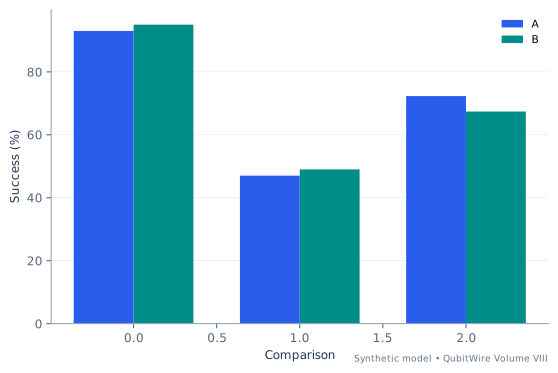
Compare the input regimes
Each case uses invented inputs. The results follow from this model and do not describe measured hardware.
Baseline regime
Complete inputs
- A easy success
- 0.93
- A hard success
- 0.47
- B within-stratum gain
- 0.02
- A easy workload fraction
- 0.55
- B easy workload fraction
- 0.4
- Reference easy fraction
- 0.2
- A is weighted using 55% easy work; B uses 40%. Those are different test distributions.
- Use the shared 20% easy reference for both: A = 0.562, B = 0.582.
- The raw difference is -4.9 percentage points. The shared-workload difference is 2 percentage points.
| Calculated quantity | Synthetic result |
|---|---|
| A mixed success (%) | 72.3 |
| B mixed success (%) | 67.4 |
| Raw B minus A (percentage points) | -4.9 |
| A standardized success (%) | 56.2 |
| B standardized success (%) | 58.2 |
| Standardized gain (percentage points) | 2 |
The direction reverses after standardization. B was defined to improve both strata by 2 percentage points. Aggregation cannot identify that fact without the workload mix. These rates are stipulated probabilities, not estimates with sampling intervals.
Comparison regime
Complete inputs
- A easy success
- 0.93
- A hard success
- 0.47
- B within-stratum gain
- 0.03
- A easy workload fraction
- 0.7000000000000001
- B easy workload fraction
- 0.325
- Reference easy fraction
- 0.45
- A is weighted using 70% easy work; B uses 32.5%. Those are different test distributions.
- Use the shared 45% easy reference for both: A = 0.677, B = 0.707.
- The raw difference is -14.25 percentage points. The shared-workload difference is 3 percentage points.
| Calculated quantity | Synthetic result |
|---|---|
| A mixed success (%) | 79.2 |
| B mixed success (%) | 64.95 |
| Raw B minus A (percentage points) | -14.25 |
| A standardized success (%) | 67.7 |
| B standardized success (%) | 70.7 |
| Standardized gain (percentage points) | 3 |
The direction reverses after standardization. B was defined to improve both strata by 3 percentage points. Aggregation cannot identify that fact without the workload mix. These rates are stipulated probabilities, not estimates with sampling intervals.
Extended regime
Complete inputs
- A easy success
- 0.93
- A hard success
- 0.47
- B within-stratum gain
- 0.041999999999999996
- A easy workload fraction
- 0.88
- B easy workload fraction
- 0.23500000000000004
- Reference easy fraction
- 0.75
- A is weighted using 88% easy work; B uses 23.5%. Those are different test distributions.
- Use the shared 75% easy reference for both: A = 0.815, B = 0.857.
- The raw difference is -25.47 percentage points. The shared-workload difference is 4.2 percentage points.
| Calculated quantity | Synthetic result |
|---|---|
| A mixed success (%) | 87.48 |
| B mixed success (%) | 62.01 |
| Raw B minus A (percentage points) | -25.47 |
| A standardized success (%) | 81.5 |
| B standardized success (%) | 85.7 |
| Standardized gain (percentage points) | 4.2 |
The direction reverses after standardization. B was defined to improve both strata by 4.2 percentage points. Aggregation cannot identify that fact without the workload mix. These rates are stipulated probabilities, not estimates with sampling intervals.
Try the reasoning: Choose a second common workload distribution. Does the within-stratum improvement change, or only the aggregate score?
Explore the broader guide: Understanding quantum benchmarks →